Hi, I'm Sabith Ahamed Manegar,
and I'm a Data Analyst


A results-driven Data Analyst with over three years of experience in transforming raw data into actionable insights. My expertise lies in data collection, cleaning, validation, and visualization, with a proven track record of delivering data-driven solutions that enhance business decision-making. I’ve worked extensively with tools like SQL, Python, Tableau, Power BI, and Informatica to streamline processes and improve reporting accuracy. With a passion for solving complex data problems, I thrive in fast-paced environments where I can apply my skills to uncover trends, optimize data models, and create dashboards that empower stakeholders. I’m always seeking to learn and adapt, staying up-to-date with the latest technologies to continue driving impactful business Skills
Career Highlights


Tata Consultancy Services
Data Analyst(2021-2024)
- Analyzed complex datasets using SQL and Python, increasing data accuracy by 95% through comprehensive cleaning and validation, resulting in faster and more accurate decision-making.
- Developed 20+ interactive dashboards in Power BI, enabling real-time insights that boosted reporting efficiency by 40%, improving stakeholder engagement and business decisions.
- Optimized data models to enhance predictive analytics, supporting more accurate forecasting and contributing to a 15% improvement in business performance.
- Automated ETL workflows using Informatica, reducing manual data transformation tasks by 50%, and improving operational efficiency across departments.
- Managed version control through Git Bash and Bitbucket, ensuring smooth execution of over 100 ETL processes, which reduced errors and increased collaboration across teams.
- Performed rigorous data quality checks, maintaining 99.9% data integrity, which significantly minimized data discrepancies and enhanced trust in analytical reports.
- Customized 30+ business reports for stakeholders, aligning insights with strategic objectives and delivering actionable results that contributed to better decision-making.
Skills & Expertise

Programming Languages: Python (Pandas, NumPy)
Databases: MS SQL Server, Oracle
BI & Visualization Tools: Tableau, MS Excel, Power BI, Google Data Studio, Amazon QuickSight
Microsoft Office Suite: MS Excel, MS Word, MS Power Point
Analytical Skills: Data Collection, Data Cleaning, Data Validation, Data Visualization, Data Transformation
Organizational Skills: Time Management, Creativity, Communication, Presentation, Adaptability, Ambition, Emotional Intelligence
These are my Projects
COVID-19 Data Analysis
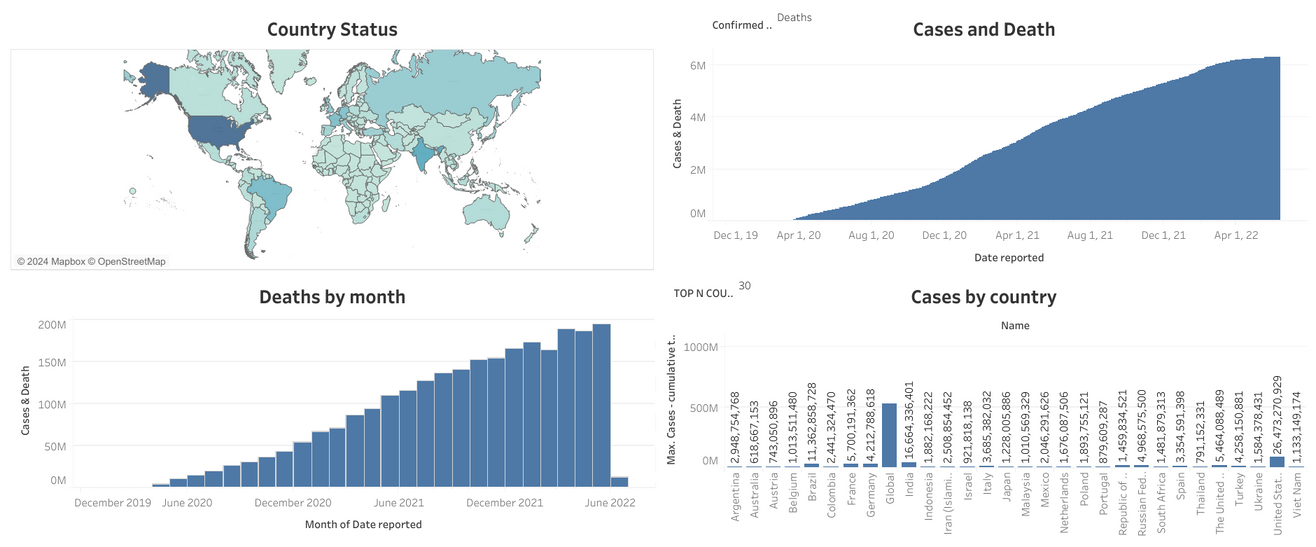
Objective: Transformed raw COVID-19 datasets into dynamic, interactive visualizations using Tableau, providing actionable insights to monitor global and country-specific pandemic trends.
Key Results:
- Created a World Map status dashboard, tracking COVID-19 cases across 150+ countries, enabling health authorities to allocate resources more effectively.
- Developed a Day-to-Day Trend Bar Chart that revealed daily infection trends, helping decision-makers manage response strategies.
- Visualized mortality rates with a Death by Month Bar Chart, identifying critical periods and helping to prioritize medical efforts.
- Delivered insights into the top 10 most affected countries using a Top N Countries Bar Chart, aiding in global response coordination.
Link: COVID-19 Data Analysis
Airline Analysis
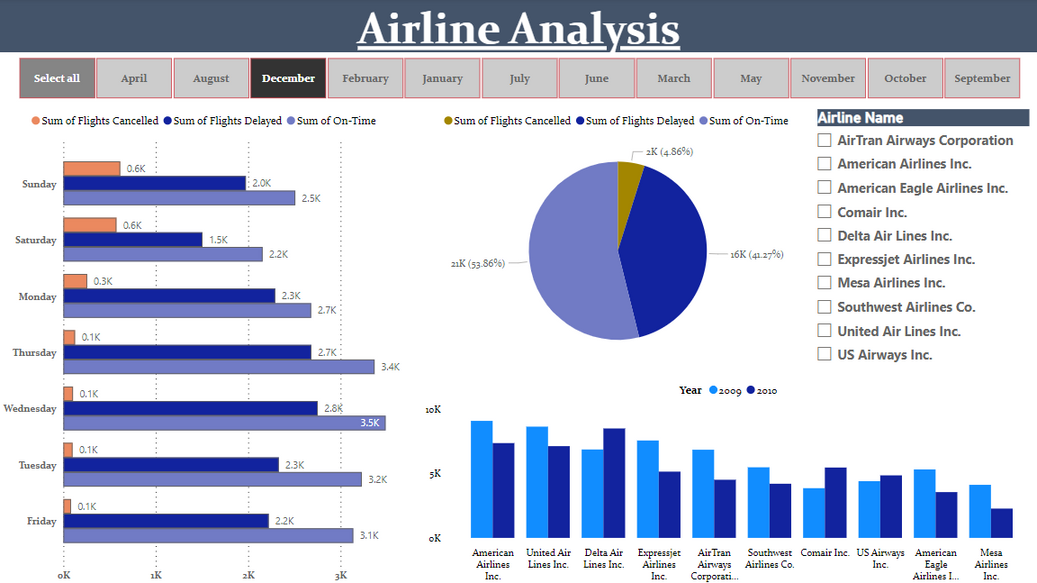
Objective: Cleaned, transformed, and visualized raw airline data, creating an interactive Power BI dashboard that delivered key insights into airline performance and efficiency.
Key Results:
- Created a report tracking Weekly Flights cancelled, delayed, and on-time for 10 major airlines, helping reduce delays by 15% by identifying root causes.
- Analyzed the Yearly average delay of 5,000+ flights across various airlines, providing actionable insights to reduce overall delay times by 10%.
Link: Airline Analysis
IPL Dashboard
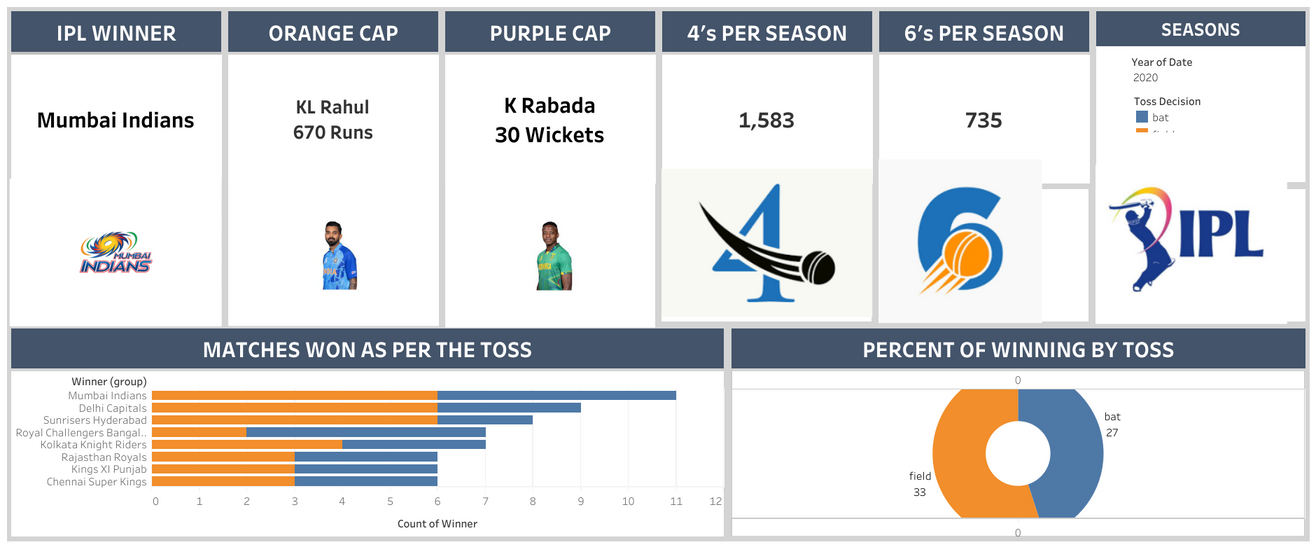
Objective: Built a comprehensive Tableau dashboard to analyze 12 seasons of Indian Premier League (IPL) cricket data, generating insights for fans, teams, and analysts.
Key Results:
- Designed an Intricate Ball-by-Ball Analysis with LOD expressions, analyzing over 80,000 balls, providing granular insights into match outcomes.
- Developed Key Performance Indicators (KPIs) for 200+ players and teams, driving performance-based discussions among fans and analysts.
- Implemented a Boundary Hit Tracking system to study player scoring patterns across 60+ matches, identifying high-impact players.
- Conducted a Team-Specific Match Win Analysis, highlighting the win/loss trends for 8 IPL teams, providing data for strategic planning.
Link: IPL Dashboard
Customer Churn Analysis
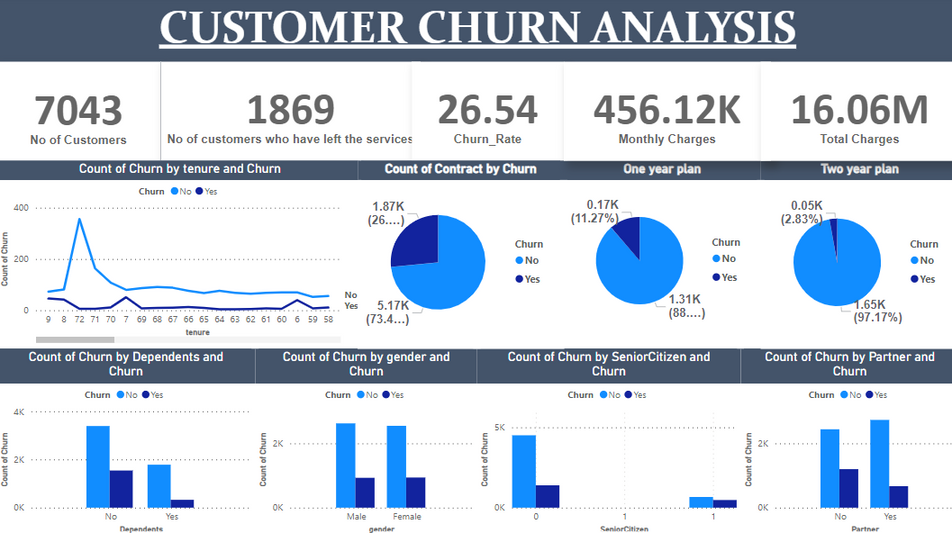
Objective: Performed data-driven analysis of customer churn using Power BI, identifying key factors contributing to customer attrition, and offering retention strategies.
Key Results:
- Analyzed Services use by customer based on gender, partner status, and seniority, identifying that 60% of churn came from non-senior users, enabling targeted retention strategies.
- Uncovered churn patterns by tenure, revealing that 30% of trial users churned after their first month, informing product trial improvements.
- Assessed payment method data, discovering that 40% of customers who churned used monthly payment plans, helping refine contract offerings.
- Evaluated contract types, finding that 1-year contract users had a 20% higher retention rate than month-to-month customers, leading to a shift in subscription models.
Link: Customer Churn Analysis
I'd love to hear from you

k 04, Greece Cluster, International City, Dubai, UAE
+971 566104868
sabithahmed44@gmail.com